DLMF
Menu
Index
Notations
Search
Help?
Citing
Customize
Annotate
UnAnnotate
About the Project
22
Jacobian Elliptic Functions
Properties
22.3
Graphics
22.3
Graphics
22.4
Periods, Poles, and Zeros
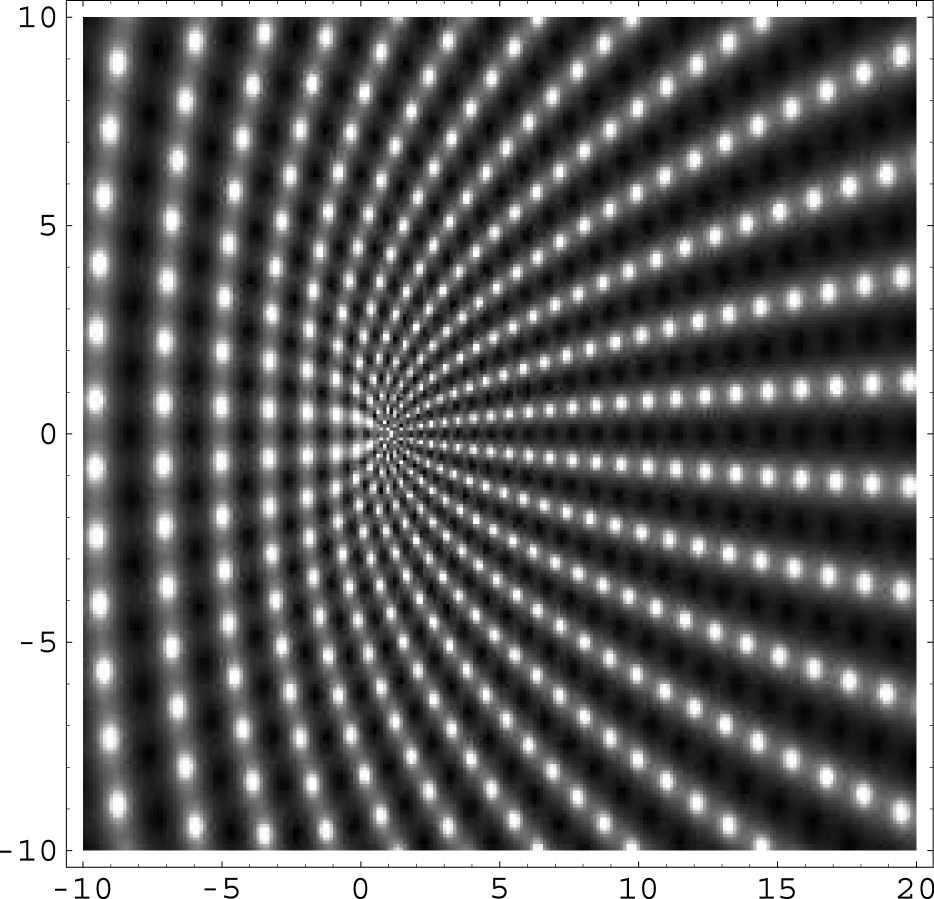
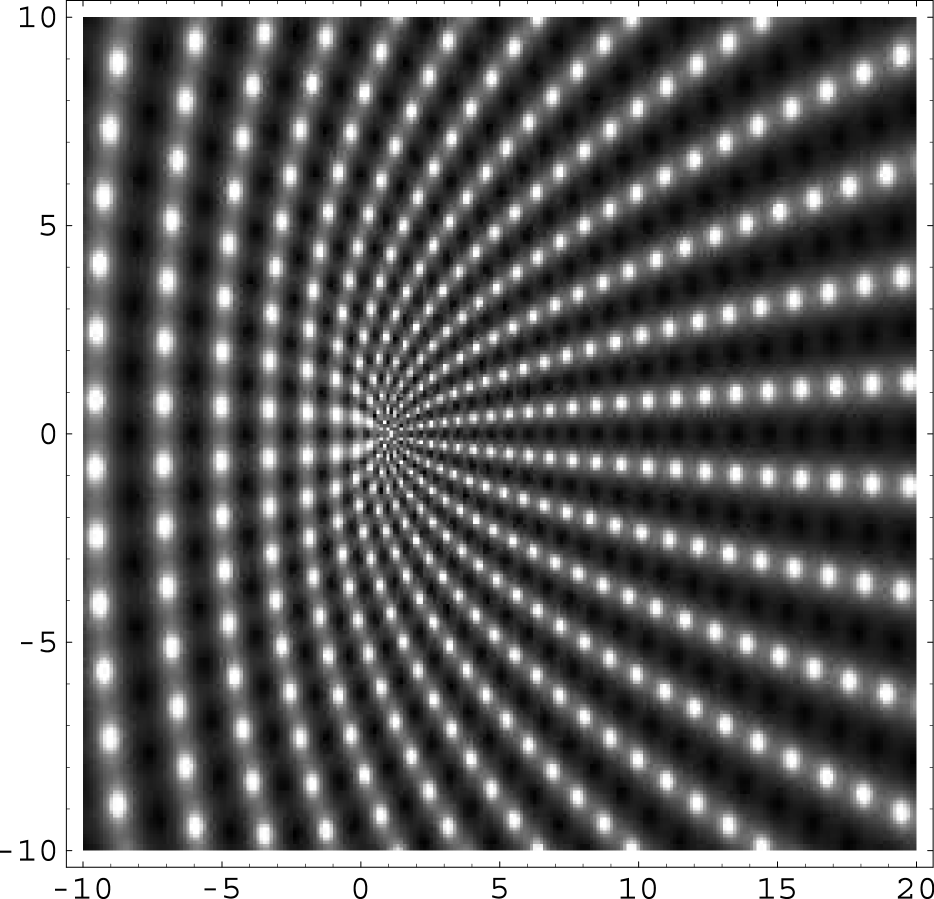
Figure 22.3.28
(See
in context
.)
Figure 22.3.28:
Density plot of
|
sn
(
20
,
k
)
|
as a function of complex
k
2
,
−
10
≤
ℜ
(
k
2
)
≤
20
,
−
10
≤
ℑ
(
k
2
)
≤
10
. Grayscale, running from 0 (black) to 10 (white), with
|
sn
(
20
,
k
)
|
>
10
truncated to 10. White spots correspond to poles.
ⓘ
Annotations:
Symbols:
sn
(
z
,
k
)
: Jacobian elliptic function
,
ℑ
: imaginary part
,
ℜ
: real part
and
k
: modulus
Keywords:
Jacobian elliptic functions
,
complex
,
modulus
Permalink:
http://dlmf.nist.gov/22.3.F28.mag
Encodings:
Magnified png
,
pdf
See also:
Annotations for
§22.3
and
Ch.22